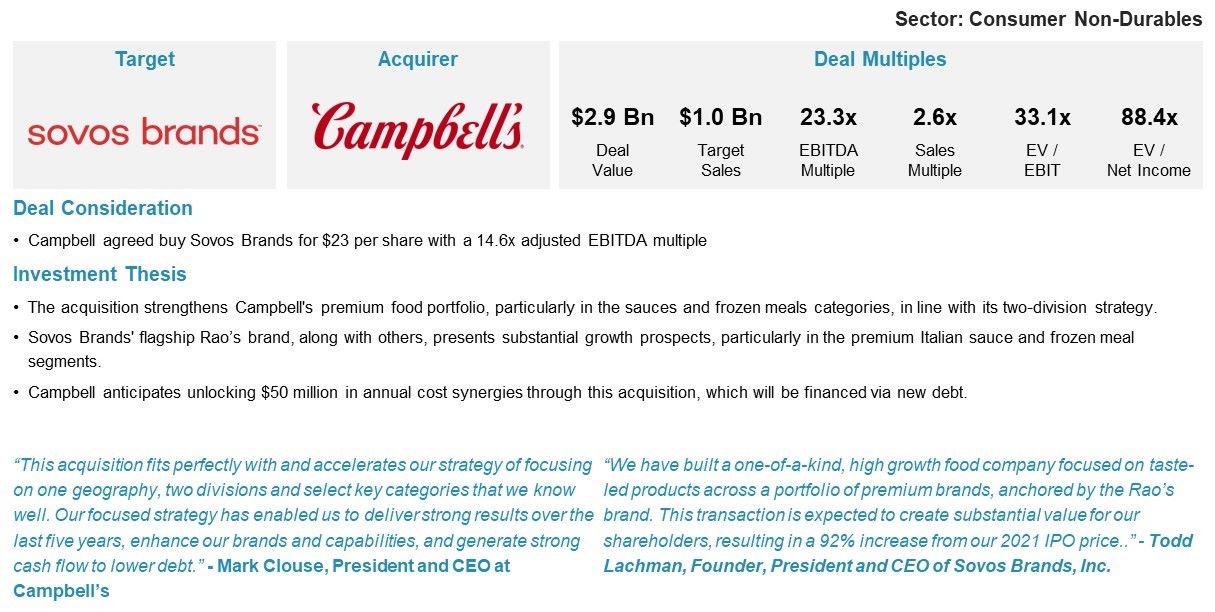
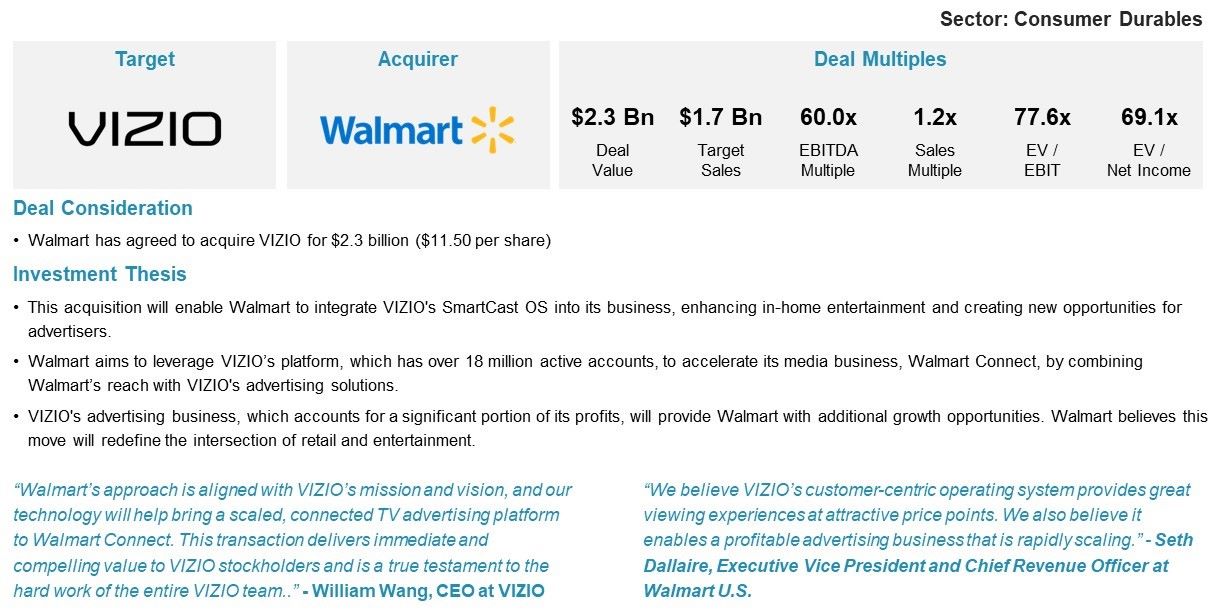
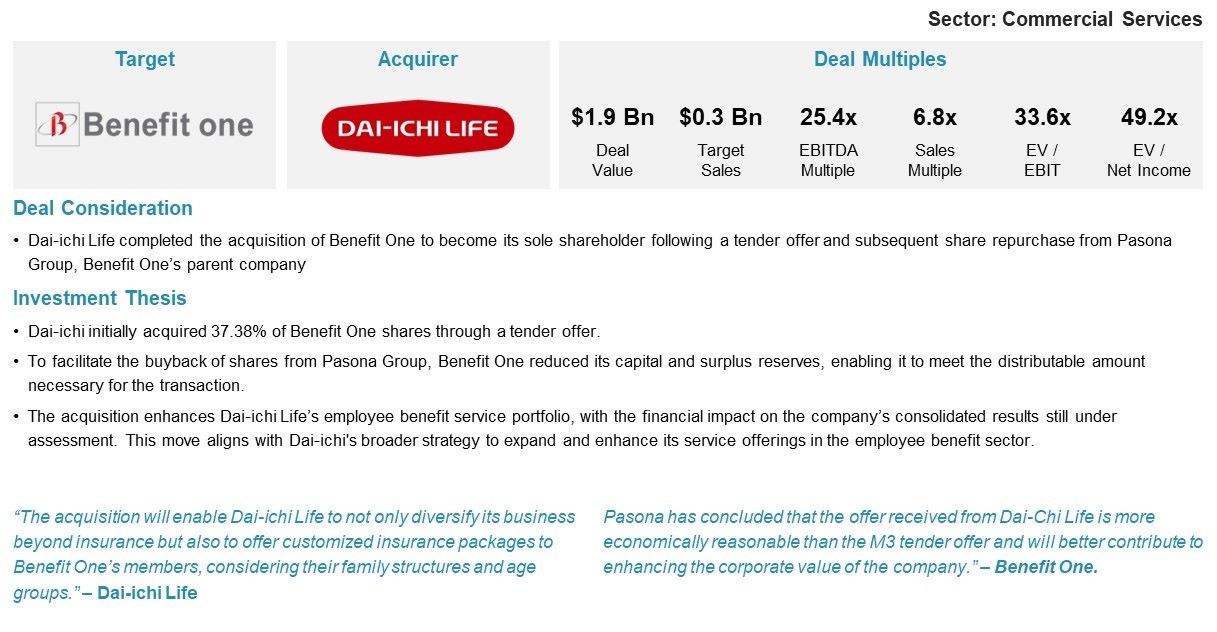
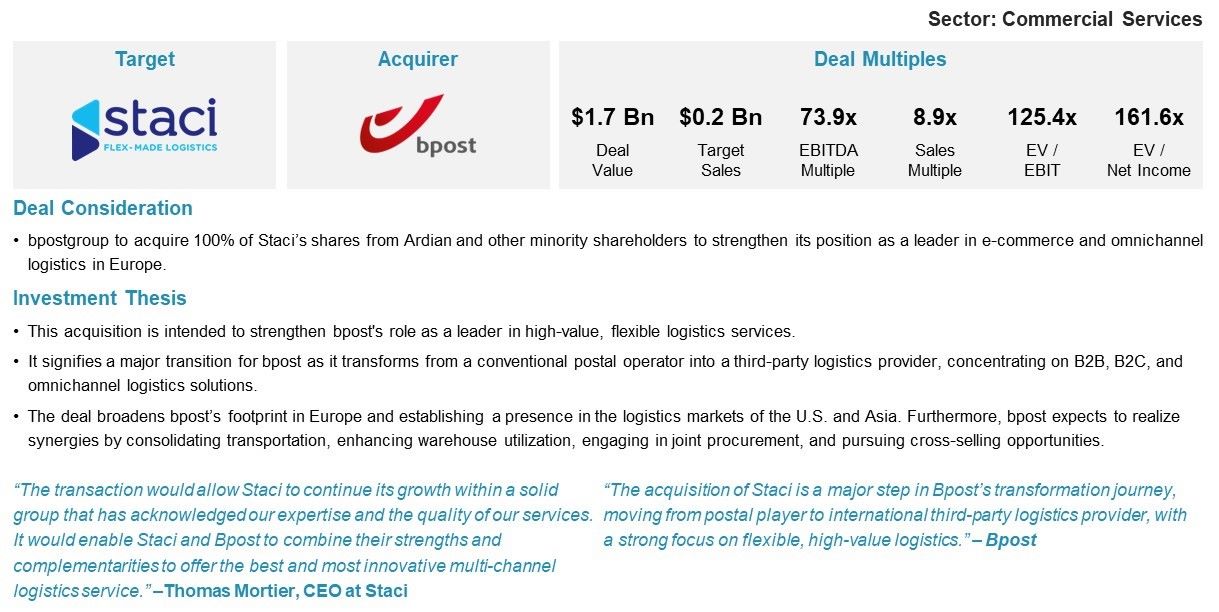
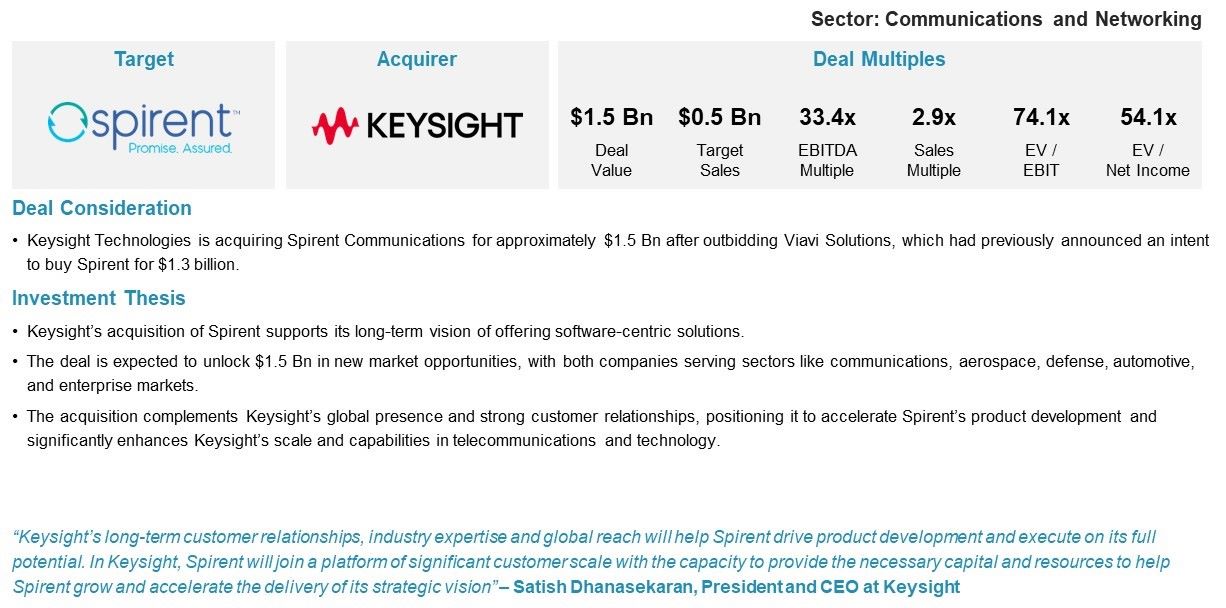
Global M&A Pulse: Key Transactions and Market Movements
Aranca provides a comprehensive suite of solutions focused on driving consolidation across diverse industries and regions. Discover our M&A Deal Activity Tracker for easy access to valuable intelligence on mergers and acquisitions, featuring detailed analysis, current trends, and key insights into the ever-evolving M&A landscape.
Global M&A activity gained momentum in 2024, driven by pent-up demand from companies seeking diversification and market expansion. However, sponsor-backed deals slowed due to high interest rates affecting fundraising efforts.
Investors, especially in North America, focused on cross-border deals in Europe and emerging markets to capitalize on strong currency values and favorable investment multiples.
Deal activity in H1 was primarily led by the commercial products and services (34%) and software and IT service (15%) sectors, followed by financial services, consumer durables, and healthcare services.
Despite fluctuations, deal valuations have stabilized, indicating a growing M&A market in the second half of 2024.
The market is poised for further growth, fueled by recent cut in interest rates, the deployment of dry powder, and narrowing valuation gaps. Key focus sectors include emerging technologies such as AI, life sciences, and biotechnology.

Post-COVID-19, M&A activity surged in 2021 as companies took advantage of market disruptions and economic recovery. With ample liquidity, low-interest rates, and the acceleration of digital transformation, businesses pursued acquisitions to bolster market positions and expand capabilities. The pandemic also led to strategic shifts, resulting in divestitures and industry consolidation. Consequently, 2021 saw record-breaking deal volumes, signalling renewed confidence in the global economy.
However, as markets reopened post-pandemic, M&A activity slowed. By 2023, a significant valuation gap between buyers and sellers hindered deals. High interest rates, macroeconomic uncertainty, regulatory scrutiny, and political pressures further contributed to the downturn. The lower levels of M&A activity over the past two and a half years created pent-up demand (and supply), particularly in the PE universe. In addition, corporates are turning to M&A to accelerate growth and reinvent their businesses. Interest rates and regulatory scrutiny particularly impacted M&A closures in healthcare, where regulators like the European Commission, UK Competition and Markets Authority, and U.S. agencies expressed caution. Geopolitical instability and evolving antitrust laws also dampened activity in sensitive sectors such as semiconductors and nuclear energy.
Cross Border Deal Activity
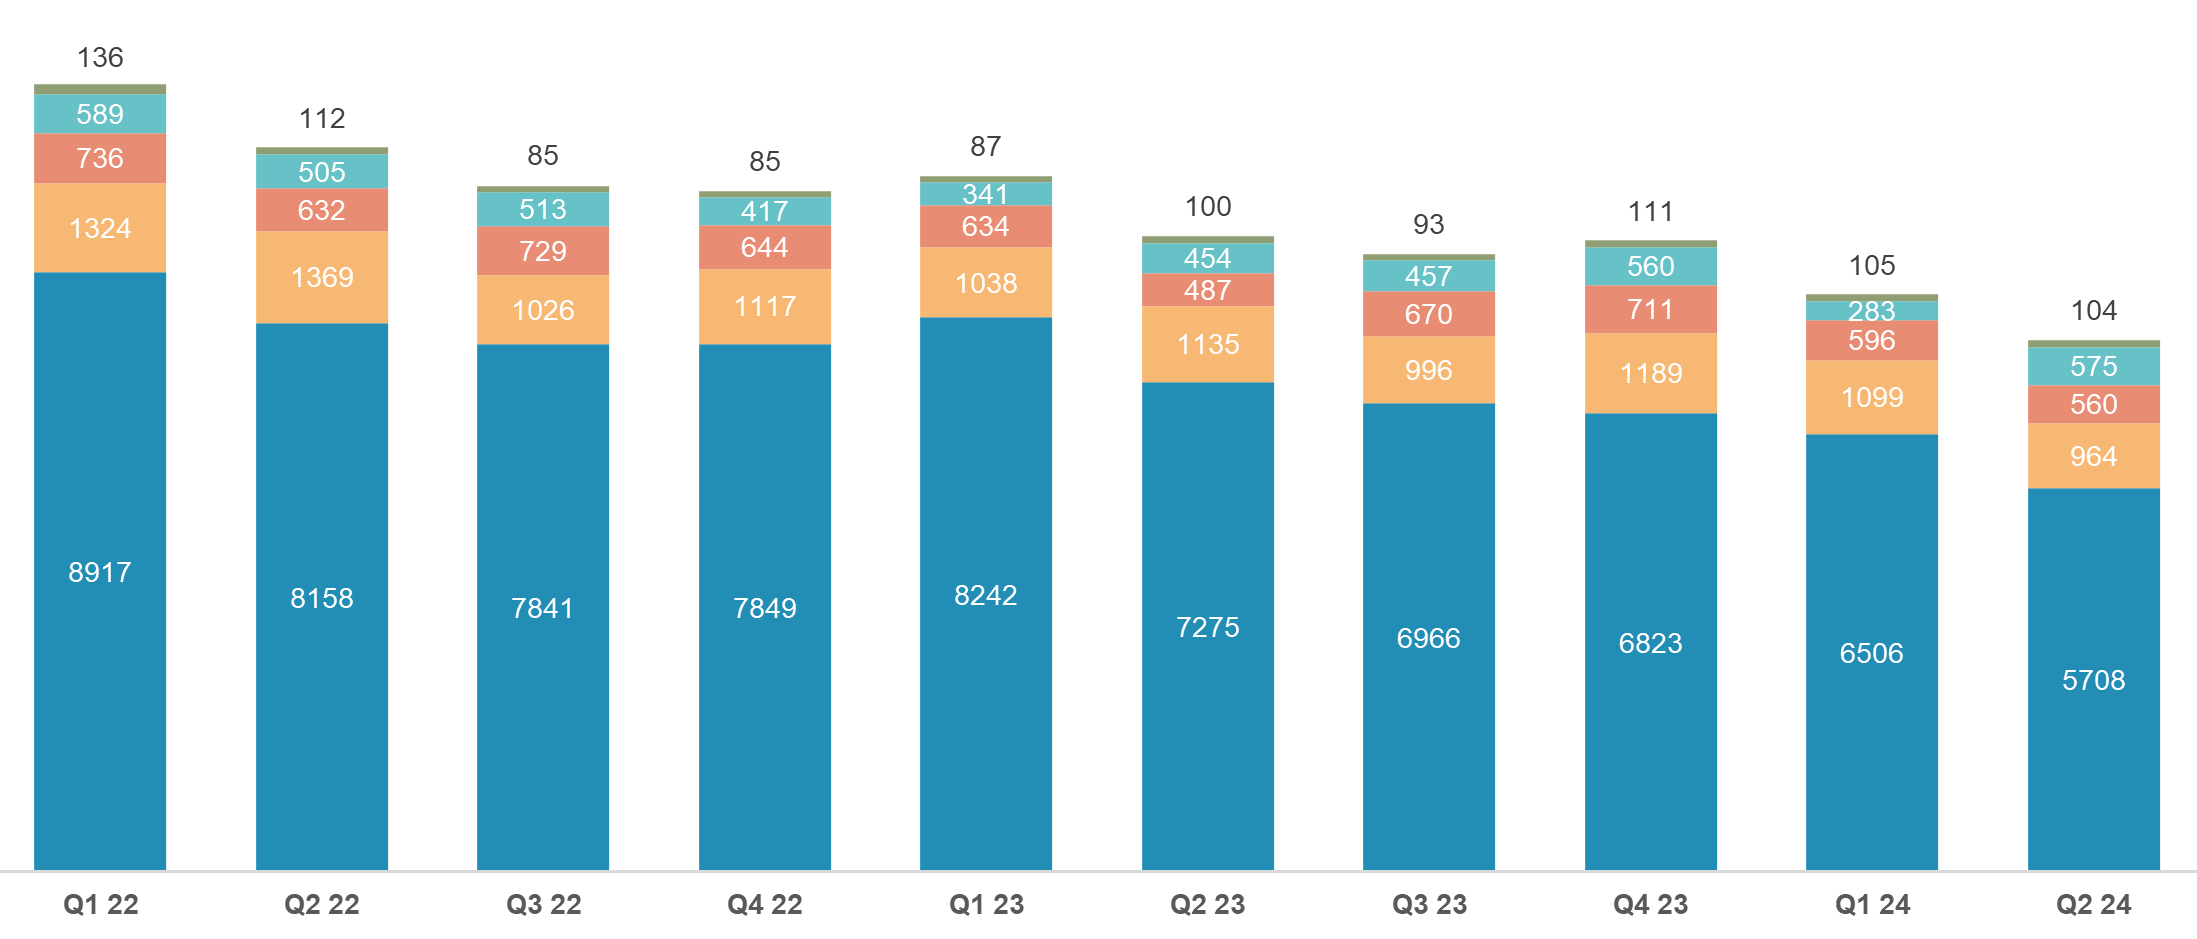
The recent resurgence, however, has been driven by banks re-entering the market and competing with nonbanks, effectively lowering rates for dealmakers despite central banks, except for the ECB, holding interest rates steady. In H1 2024, transaction value increased by 1%, reaching USD 1,467 billion, up from USD 1,452 billion in H1 2023. Despite this slight growth in value, deal volume dropped by 17%, with 16,500 completed deals, compared to 19,790 in the same period the previous year.
Investors actively focused on cross-border deals to diversify geographically and tap into favorable business environments. U.S. buyers led global diversification, with Brazil remaining attractive to foreign investors despite domestic dealmaking declines. The Middle East, particularly through sovereign wealth funds, increased investments in Asia by 60%, aiming to build supply chains and support energy transitions. The strong U.S. dollar, compared to the euro and pound, also made cross-border deals more appealing, with European targets seeing lower purchase price multiples. A longer-term shift is emerging in the M&A market, with companies exploring alternative transaction structures to hedge against potential slowdowns.
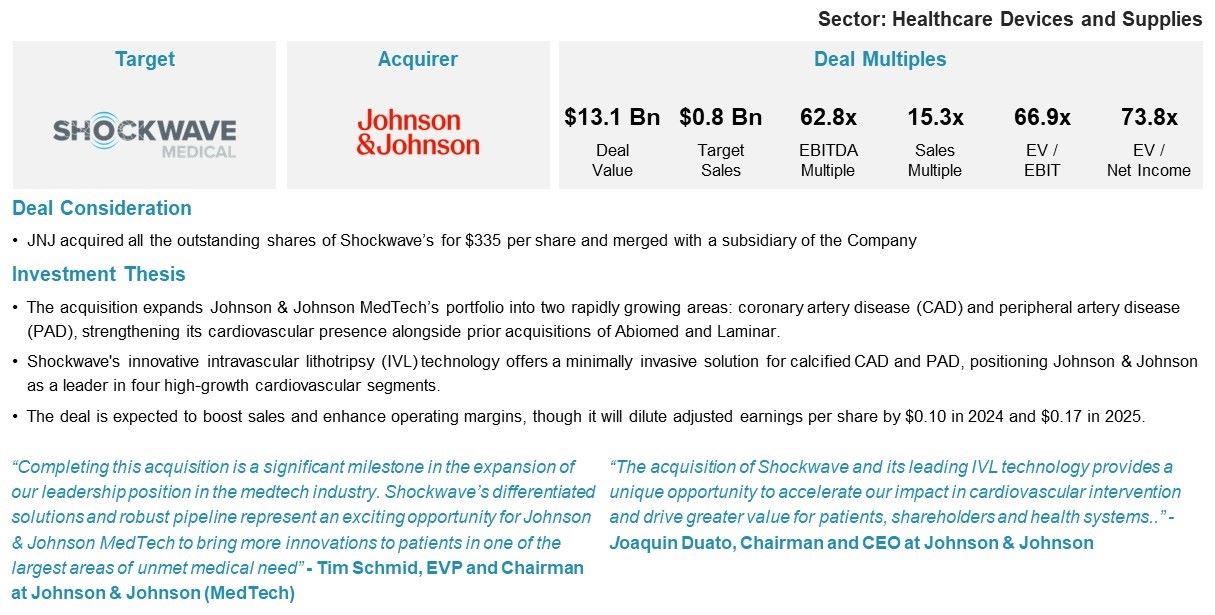
Most deal activity in H1 2024 centered on transactions under $1 billion, which made up ~99% of deal volume. Key sectors included energy and IT, each with three major deals, followed by business services with two, and one each in healthcare and financial services. Notable Q2 deals included ConocoPhillips’ acquisition of Marathon Oil for $22.5 billion and Johnson & Johnson’s purchase of Shockwave Medical for $13.1 billion.
Deal Volume by Deal Size
Investors shifted toward public equities, driven by the rise of "boomerang" stocks where companies return to private ownership soon after going public. Given recent market volatility, PE owners are increasingly taking back portfolio companies or selling their remaining stakes to other PE firms to create value.
In renewable energy, notable deals included Brookfield Renewable Partners’ acquisition of a 53.3% stake in French renewable power producer Neoen, valued at $7.1 billion, and Energy Capital Partners’ purchase of Atlantica Sustainable Infrastructure for $2.6 billion. In healthcare, pharmaceutical and biotech deals continued to dominate, with VC and PE firms focusing on building emerging medicine capabilities in the U.S. or consolidating the domestic PharmaTech sector, while others invested in cost-effective global services, especially in China and Europe.
Meanwhile, medtech M&A focuses on expanding offerings through consolidation, but the sector faces heightened regulatory scrutiny. This trend has dampened investor interest in medtech and life sciences tools, as large M&A exit opportunities appear less promising. Struggling startups may increasingly pursue smaller or earlier exits, such as those seen with Illumina and Fluent BioSciences.
Deal Analysis of Top 15 Industry Groups| Sector ($ Mn) | Deal Count | Deal Size | % of total Deal Volume | % of total Deal Value |
|---|---|---|---|---|
| Commercial Products & Services | 5,681 | 179,447 | 34% | 12% |
| Software and IT Services | 2,483 | 166,876 | 15% | 11% |
| Financial Services | 743 | 74,186 | 5% | 5% |
| Consumer Non-Durables | 715 | 27,127 | 4% | 2% |
| Healthcare Services | 650 | 29,519 | 4% | 2% |
| Transportation | 641 | 36,153 | 4% | 2% |
| Restaurants, Hotels and Leisure | 611 | 23,158 | 4% | 2% |
| Media | 432 | 47,271 | 3% | 3% |
| Retail | 382 | 9,453 | 2% | 1% |
| Insurance | 381 | 51,495 | 2% | 4% |
| Other Business Products and Services | 360 | 64,395 | 2% | 4% |
| Pharmaceuticals and Biotechnology | 304 | 206,131 | 2% | 14% |
| Energy Services | 274 | 30,954 | 2% | 2% |
| Consumer Durables | 228 | 5,142 | 1% | 0% |
| Healthcare Devices and Supplies | 187 | 31,246 | 1% | 2% |
| 16,500 | 1,467,000 | 85% | 67% |

At the start of 2024, PE firms managed over 28,000 portfolio companies globally, with half held for at least four years, priming them for exits. By mid-year, many of these investments had aged further, increasing pressure from investors for returns, especially as firms raise new funds. Those unable to make distributions could struggle to raise new capital. Meanwhile, corporates grapple with a disruptive environment driven by macroeconomic trends, geopolitical tensions, and technological changes, particularly AI. To succeed, companies need strong M&A strategies, focusing on acquiring key assets or divesting non-core ones.
Although corporate deals saw significant growth, PE deal flow initially lagged due to high interest rates and weak exit activity. However, in Q2 2024, PE activity rebounded, with its share of M&A deal value rising to 41%. Historically, PE firms were major players in M&A but faced challenges due to a reliance on debt. The biggest obstacle has been the valuation gap, which led to the lowest year for strategic M&A in a decade. Rising interest rates and a strong stock market widened the gap between private and public market valuations, as sellers preferred holding assets over selling at lower multiples.
In the first half of 2023, deal multiples in North America and Europe remained stable, continuing the trend that defined much the year. The median EV/EBITDA multiple for M&A transactions announced or completed in H1 2024 held steady at 9.5x, the same as in full-year 2023. Similarly, EV/revenue multiples were unchanged at a median of 1.6x in H1 2024, identical to 2023’s figure.

While M&A multiples remain 15% to 20% below the 2021 peak of 11.0x EBITDA and 2.1x revenue, the sustained stability suggests that the valuation reset may now be complete. Current multiples have settled slightly below the pre-COVID-19 averages from 2017 to 2019, which is expected given today’s higher interest rates.
| Sector | EBITDA Multiple | Revenue Multiple |
|---|---|---|
| Commercial Services | 7.12 | 1.15 |
| Commercial Products | 6.99 | 1.24 |
| Software | 13.89 | 3.05 |
| Consumer Non-Durables | 11.44 | 1.58 |
| Healthcare Services | 14.81 | 1.13 |
| IT Services | 8.72 | 1.51 |
| Restaurants, Hotels and Leisure | 5.75 | 2.16 |
| Media | 9.34 | 1.6 |
| Transportation | 16.86 | 0.67 |
| Retail | 9.57 | 0.25 |
| Insurance | 9.56 | 1.4 |
| Pharmaceuticals and Biotechnology | 10.03 | 12.92 |
| Energy Services | 7.11 | 2.35 |
| Apparel and Accessories | 5.14 | 0.52 |
| Containers and Packaging | 7.54 | 0.58 |
| Semiconductors | 20.44 | 2.02 |
| Healthcare Devices and Supplies | 45.69 | 4.61 |
With ample dry powder for both strategic and private equity buyers, along with potential rate cuts, the macroeconomic outlook looks favorable for M&A activity. Deal volumes are expected to rise, particularly in sectors focused on integrating new technologies like AI, and in the life sciences and biotechnology space. The persistent valuation gap that has limited deals over the past year is gradually being addressed, creating more acquisition opportunities.
As central banks, including the ECB, are likely to reduce rates, borrowing costs will decrease, benefiting M&A transactions, especially for rate-sensitive PE buyers. Corporate buyers, meanwhile, may face renewed competition for assets. Recent rate cuts in Switzerland, Sweden, Canada, and the ECB signal further reductions, which will aid dealmakers relying on debt financing.
Looking ahead to H2 2024, M&A activity in Europe is projected to increase, driven by monetary easing. Reduced borrowing costs will encourage more PE buyouts, creating a competitive landscape for corporate acquisitions. However, the U.S. presidential election and potential fiscal stimulus could influence inflation and corporate profitability, potentially tempering the positive M&A trends. Subsequent monetary policy adjustments could also dampen the buyer appetite for leverage and negatively affect valuations.
Source: Pitchbook, Aranca Analysis
Aranca is a global research analytics and advisory firm with over 20 years of experience in helping organizations take strategic business and investment decisions fearlessly and with utmost conviction.
© , Aranca. All rights reserved.
